Now that the excitement over the Olympics has abated a bit, it is time to reflect on the outcomes to see if we can discern any long term trends.
Most casual observers seem to be most interested on the outcomes (=medals) as a function of nationality. This is not surprising, as it is perhaps taken as a proxy for relative competitiveness of the home country of the individual. Therefore, we will focus our analysis on these metrics.
Based on medal counts alone, it can be hard to factor out extra-athletic political developments, which is why we limit the time frame to the last 7 olympics, going back to 1988. Before that, cold war events such as the large scale boycott of Moscow in 1980 or Los Angeles in 1984 by the “other” political block led to obvious distortions of the outcomes. For instance, the US won 88 gold medals in 1984, or more than 35% of the total – a highly unusual result, which is likely owed to the absence of most athletes from the eastern bloc. This yields a analysis period of 28 years, sufficiently long to discern long term trends.
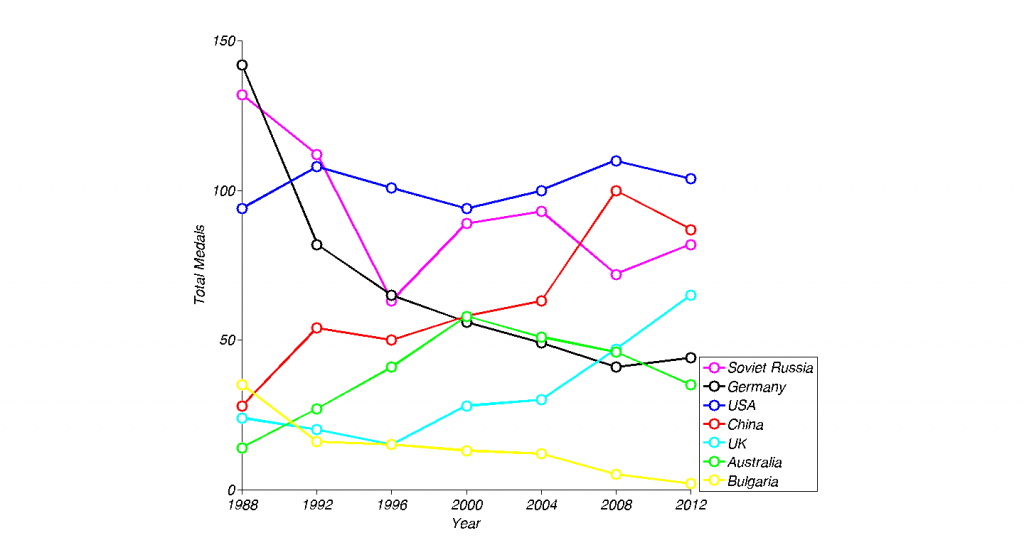
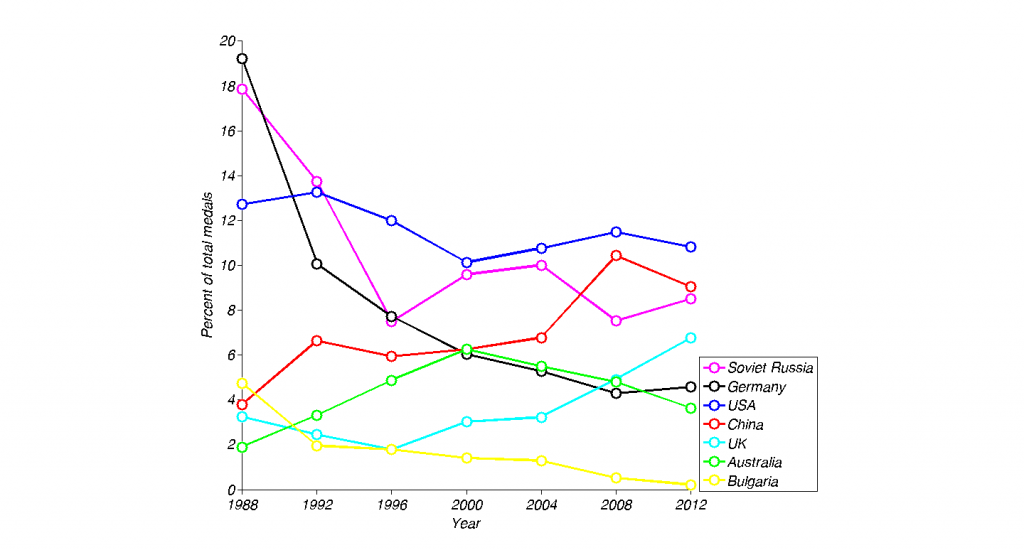
For these last 7 Olympic Games, figure 1 shows the basic results.
It may look complicated, but there are some clear trends. Before we go further into that, let’s discuss some necessary preliminaries. Seven countries were picked, based on them being relatively successful (being in the top 10 of countries at least once during the time period), and them showing some development. Nations that were extremely stable, e.g. South Korea, which has been consistently around 30 medals have been omitted. As have been others that basically show the same general trend as those shown, e.g. Romania and Hungary show the same trend as Bulgaria, which is shown. Restricting it to seven nations allowed the use of seven distinct and easily recognizable colors. I did want to include more, but the graph was already busy enough as it is. Some other remarks about the mechanics of the figure: In the spirit of keeping politics at bay as much as possible, “Soviet Russia” includes the Soviet Union in 1988, the “United Team” in 1992 and the Russian team post 1992 (to indicate legal and organizational continuity). “Germany” combines both East and West Germany in 1988 and unified Germany thereafter. The “UK” refers to the team that calls itself Great Britain, further increasing the confusion between the Great Britain/UK distinction. The designation was made in 1908 to avoid an Irish boycott, but Ireland has fielded its own team for a long time now and it is unfair to athletes from Northern Ireland, which is why this anachronism is incorrect.
Two major trends become apparent:
1. Communism/central planning boosts medal counts. It is hard to distinguish between the two, as basically all remaining central planning regimes are also communistic in nature. The dramatic decline in medals from countries that abandoned communism (Germany, Bulgaria, Soviet Russia as well as others not shown) contrasts with the continued success of countries that retained it (China, and others not shown, e.g. Cuba, North Korea). The effect is very real, but it is unclear how to interpret it. Do communist countries value the olympics more (perhaps as an outward sign of pride)? Does sports performance lend itself to central planning? The German results highlight that this might be so. In 1988, East Germany won 2.5 times the medals that West Germany did, despite the West having almost 4 times the population at the time. In other words, based on population alone, East Germany was outperforming West Germany by a factor of almost 10:1. Note that this happened in spite of the famed abundance of economic resources in the west, compared to the east.
2. The outcomes of the UK, Australia and China show that countries that host the olympics see their results boosted not only in the year in which they host the olympics itself (which could be due to some kind of home-advantage), but also in the run-up to the olympics (maybe reflecting an increased allocation of resources on athletics in a given country in preparation for the big event, perhaps not uncorrelated with the fact that they were awarded the olympics in the first place). This is consistent with a steep rise of the UK performance even before the 2012 olympics was given to London in 2005 and likely due to direct investment from the proceeds of a lottery program. Also, the performance of Australia suggests that hosts might be able to put some persistent sports infrastructure in place, which allows them to retain most – but not all of their gains. In this sense, it might be interesting to watch the Chinese performance in the future. The rise of China has led to much insecurity in the US, but it remains to be seen whether this rise is sustainable, or if the strong Chinese showing in 2008 was simply due to a confluence of several of these factors.
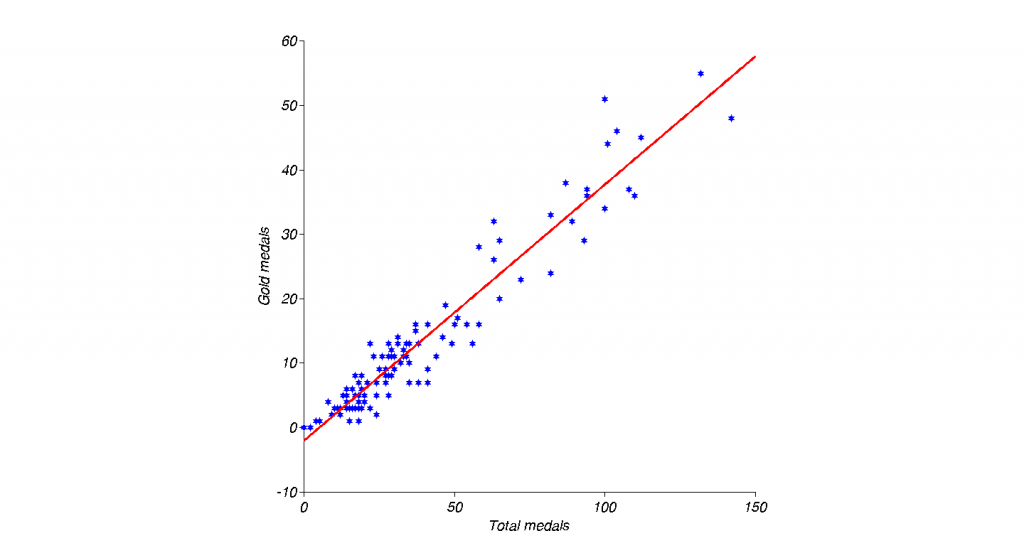
Could it be argued that a focus on total medals is perhaps misleading? Is a bronze medal really as reflective of top athletic performance as a gold medal? Is second best good enough? Purists would say no. The standard of the IOC itself is unequivocal: When used in rankings, a gold medal is infinitely more valuable than a silver one. Gold is always first. A nation which wins 1 gold medal but nothing else will always be ranked above all countries that didn’t win a gold medal, regardless of the number of silver or bronze medals won. However, this is likely to be mostly Spiegelfechterei. There is scant evidence that the distinction between medals is even reliable. Intuitively, in a field of extremely talented and competitive athletes, sheer luck or daily form might give the last 0.01% in performance differential that makes the difference between gold and silver these days. This intuition is substantiated by statistical analysis. As figure 2 shows, the correlation between total medal count (of a country) and total number of gold medals (of a country) is extremely close to perfect: r = 0.97, p = 4.47e-63. Looks marginally significant.
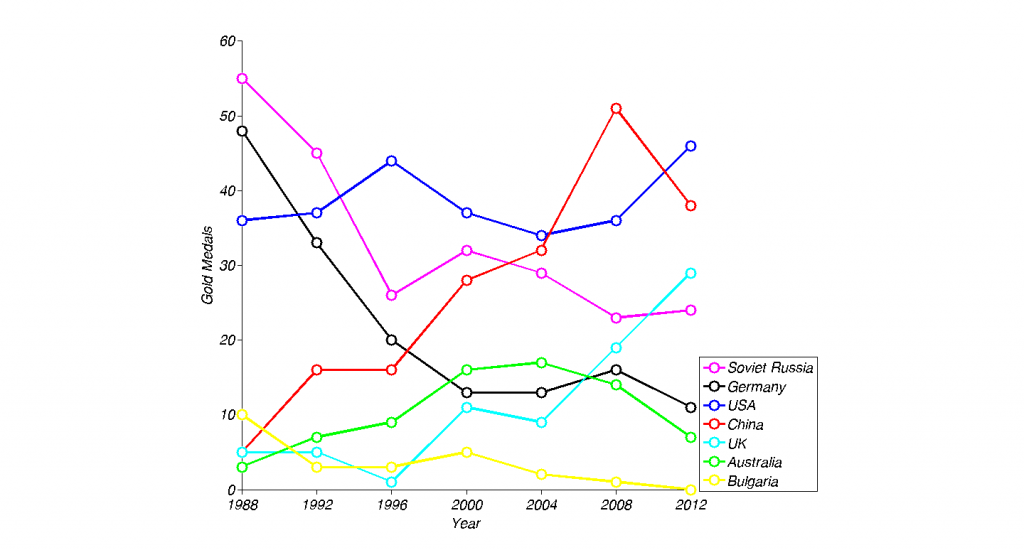
With this in mind, looking at the total medals is indeed justified, as there is 3 times the amount of data available, increasing statistical reliability. Looking at only gold medals will increase volatility of results. To check these notions empirically, we look at the same trends as above, but only at gold medals.
Figure 3 shows the same data as in figure 2, but only fore gold medals. Indeed, we can ascertain that the same trends as the ones we observe in figure 2 do hold, but they are more pronounced, exaggerated, e.g. the home advantage (which is now evident for the US numbers, even more evident for China), the decline of (East)Germany is even more evident, as are host effects across the board, etc.
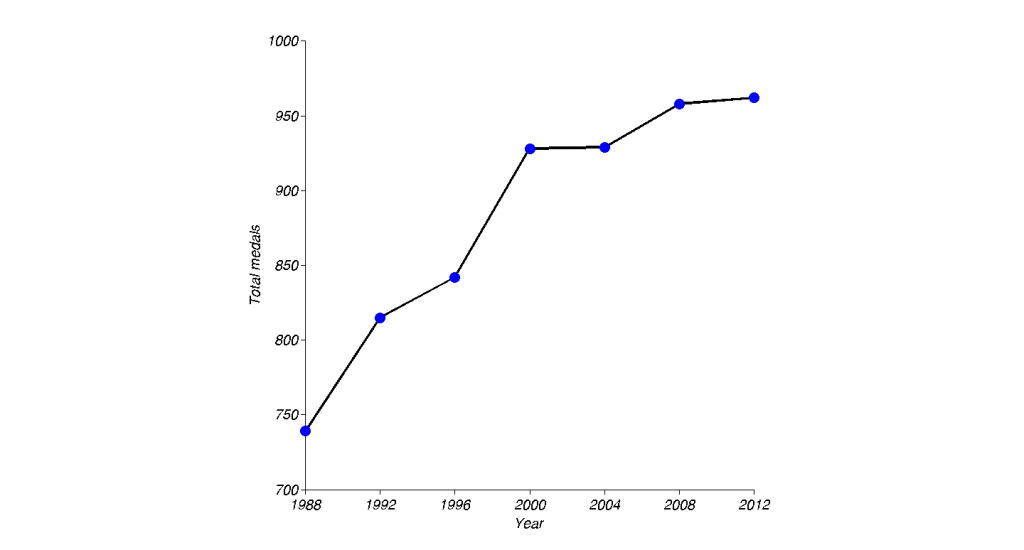
To allow for a fair comparison over time, what remains to be done is to normalize the absolute numbers by the number of medals given out at the events. This number has gone up dramatically over the years, by over 30% percent in the last 28 years alone. So looking at absolute numbers can be somewhat misleading. If the current trend holds, more than 1000 medals may be given out in the near future, as can be seen in figure 4 below (although this trend has somewhat slowed in recent years).
Taking this into account yields figure 5. Broadly speaking, the same trends hold.
This leads us to a simple model (that of course leave a lot of variance unaccounted for), but from these graphs, two things matter for olympic success of high performing nations:
1. The means to train top athletes, e.g. population and/or financial resources devoted to athletics. However, this is not in itself enough or sufficient for olympic success. This is best exemplified by India, which has a very large population and increasing available economic resources, but in spite of this only earned 5 medals at the 2012 olympics, less than Ethopia.
2. The (political?) will to do so. It is not enough for resources to be available in a country. For Olympic success, these resources need to be mobilized and focused, which perhaps happens in the runup to an olympic event and which might be important to communist regimes and lend itself to central long-term planning.
We will see if this analysis holds for the future.
So far the – mostly descriptive – side of things. I am not unaware of the larger debate about the cult around the Olymp Games as such. Some people legitimately question whether athletes exhibit the qualities and virtues we should admire as a society. This is not a trivial question in the age of rampant doping scandals. A second, related position notes that the IOC essentially leads a monopolistic and parasitic existence, feeding off the naive vanities of nations, cities and individuals alike. Totalitarian states certainly do seem to be fond of them, as it gives an opportunity to demonstrate the manifest superiority of their system before a world audience and at the same time give their oppressed populations some pride, solace and reassurance. This is a tried and true method. It worked for Hitler (Germany won by far the most medals in 1936), the Soviets, the east Germans and others. Even today, North Korea and Cuba punch far above what could reasonably be expected from them. To say nothing of China. Finally, the oft-touted inspirational effects of the Olympics, supposedly encouraging physical fitness in the general population might be largely fictional. I am not aware of a correlation between Olympic success of the athletes of a country and the BMI in the general population of that country.
These are all valid concerns, but I must respectfully insist that these issues need to be addressed at a different time as they require a different level of analysis entirely.

That is a fascinating analysis.
I would love to have seen those results graphed against GDP and population since the larger the pool of human resources the larger the potential for achievement.
Culture can have a large effect. This is particularly true when you look at the sport of rugby. Two small nations, in terms of playing population, dominate the sport, namely South Africa (the Springboks) and New Zealand (the All Blacks). South Africa also does very well in cricket. Neither nation allocates much in the way of resources to the sport. The sports are simply deeply embedded in our culture and every schoolboy will play rugby and cricket at school. I live opposite the playing fields of a medium sized Afrikaans school and watch with fascination as every afternoon the schoolboys come out onto the playing fields to play rugby or cricket, depending on whether it is winter or summer. The girls will play hockey.
Quite why and how this sporting culture has become so central in South Africa and New Zealand is not clear but the effect is clear. These nations punch far above their weight.